
Overview
![]()
University Sustainability Index (USI)
- Led by the PPRC, CBS, and the Sustainable Development Solutions Network, the University Sustainability Index (USI) project is a comprehensive, survey-based assessment that evaluates the sustainability performance of 161 universities worldwide.
- The indices will provide a robust foundation for further research, events, and the development of an international university sustainability network.
- The research team refined the Value–Process–Impact (VPI) framework to track institutions’ policy commitments, campus operations, community engagement, and research impacts.
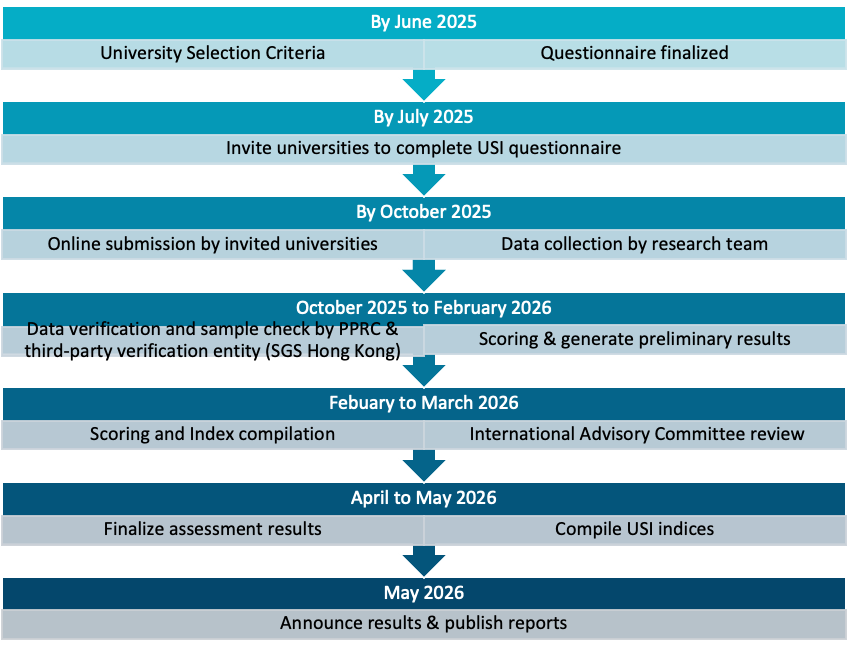
Research Design and Methodology
Selection Criteria for Index Constituent
The Global USI
The Asia-Pacific USI
The Greater China USI
The research team refined the Value–Process–Impact (VPI) framework to track institutions’ policy commitments, campus operations, community engagement, and research impacts.
The scoring is based on the 4 aspects under the VPI model, namely Value, Process (Management & Practice) and Impact, to assess University sustainability from all angles. The respective weight is as shown.
The USI assessment covers 109 indicators organised across 8 stakeholder categories. Each category draws on the Value–Process–Impact (VPI) framework: Governance indicators assess institutional values and management structures, while all other stakeholder categories are evaluated on both Practice (what universities do) and Impact (measurable outcomes). The table below summarises indicator distribution; expand any category to view the full indicator list.
| Stakeholder Category | VPI Dimensions Covered | Indicators |
|---|---|---|
| Governance | Value Process – Management | 9 |
| Students | Process – Practice Impact | 16 |
| Employees | Process – Practice Impact | 19 |
| Funding Bodies | Process – Practice Impact | 9 |
| Peer Universities | Process – Practice Impact | 10 |
| Community | Process – Practice Impact | 18 |
| Environment | Process – Practice Impact | 16 |
| Suppliers | Process – Practice Impact | 12 |
| Total | 109 |
Governance
9 indicators
USR / Sustainability Values
| Indicator | Description |
|---|---|
| Written USR/sustainability policy or statement | Existence of a written policy, vision, mission, strategy, code of conduct, or charter |
| Extent of the USR/sustainability statement | Level of detail: basic statement, descriptive, or including a conceptualisation |
| Stakeholders mentioned in USR/sustainability policy | Which stakeholder groups are explicitly referenced in the university's sustainability statement |
USR / Sustainability Management
| Indicator | Description |
|---|---|
| USR/sustainability goals | Whether formal goals exist and which stakeholders they cover |
| USR/sustainability strategic plans | Existence of strategic plans and their stakeholder scope |
| USR/sustainability programmes | Active programmes directed at specific stakeholder groups |
| USR/sustainability budget | Dedicated budget allocation for sustainability activities |
| Management structure for USR/sustainability | Formal committee, dedicated office, or senior management responsibility |
| Regular USR/sustainability reporting | Frequency and scope of published sustainability reports |
Students
16 indicators
Practice — Students
| Indicator | Description |
|---|---|
| Quality of education actions | Budget, student engagement, study support, career development, employment support, staffing quality |
| Equality and diversity advocacy | Fair admission, fair teaching/assessment, information transparency |
| Student welfare and wellbeing | Health, counselling, safe environment, study-life balance, family care, scholarships, disability access |
| Fostering students' social responsibility | Curriculum, extra-curricular activities, USR research, scholarships, student clubs |
| Appeal and complaints channels for students | Availability of ombudsperson or equivalent mechanisms for USR/sustainability issues |
| USR/sustainability communication with students | Formal and informal channels; communication frequency |
| Codes of conduct for students | Existence of student-facing USR/sustainability codes of conduct |
Impact — Students
| Indicator | Description |
|---|---|
| Awards and recognitions for student programmes | Local, national, and international recognition received |
| Student feedback rate | Percentage of positive student feedback (<40% / 40–80% / >80%) |
| Employment rate in USR/sustainability-related jobs | Share of graduates working in sustainability-related roles |
| Enrolment in USR/sustainability subjects | Percentage of students taking sustainability-related courses |
| Participation in USR/sustainability activities | Percentage of students involved in sustainability activities |
| Admission diversity statistics | Percentage of racial/ethnic minority groups in admissions |
| Student complaints trend | Trend in unsettled student complaints (increase / decrease / no change) |
| Students in sustainability exchange programmes | Number/percentage involved in sustainability-focused exchange or field trips |
| Graduation rate (normalised) | Percentage of students completing their degree (<80% / 80–95% / >95%) |
Employees
19 indicators
Practice — Employees
| Indicator | Description |
|---|---|
| Employee health and safety | Healthcare, counselling, safe workplace, work-life balance programmes |
| Workplace equity | Gender/racial equity in recruitment, job opportunities for disadvantaged groups, disability accommodation |
| Employee development and education | Training budget, career development, USR/sustainability promotion, research fund |
| Employee welfare | Healthcare benefits, pension, awards, family care, maximum working hours |
| Transparency in employment practices | Open information on recruitment, performance, salary, and management policies |
| USR/sustainability communication with employees | Formal and informal engagement mechanisms and frequency |
| Codes of conduct for employees | Existence of employee-facing USR/sustainability codes of conduct |
Impact — Employees
| Indicator | Description |
|---|---|
| Employee satisfaction level | Percentage reporting high or moderate satisfaction |
| Employee participation in voluntary sustainability activities | Share of employees involved in USR/sustainability volunteering |
| Staff turnover rate (normalised) | Annual turnover: <5% / 5–10% / >10% |
| Women in management/senior positions | Percentage of female employees in leadership roles |
| Ethnic minority representation in senior positions | Percentage of racial/ethnic minority groups in management |
| Training hours per employee per year | Average annual hours spent on development and education |
| Sustainability conference attendance per staff | Average number of sustainability-related conferences attended per staff member |
| Meetings with employee associations on sustainability | Number of formal engagement meetings with employee associations |
| Employees with disabilities | Number/percentage of staff members with disabilities |
| Workplace injuries | Occurrence of workplace injuries in the reporting year |
| Employees in sustainability-focused training | Share of employees engaged in sustainability training and development |
| Research projects/papers on sustainability | Percentage of research output with a sustainability focus |
Funding Bodies
9 indicators
Practice — Funding Bodies
| Indicator | Description |
|---|---|
| Regular communication with government/funding bodies | Frequency of meetings, information dissemination, and financial transparency |
| Regular financial audits | Frequency of external financial audits |
| Participation in government-sponsored programmes | Social, philanthropy, environmental, education, and research programmes |
| Provision of government-sponsored programmes | University-delivered programmes sponsored by government/funding bodies |
| Advocacy of USR/sustainability to policy makers | Initiatives influencing business, social, environmental, and education policy |
Impact — Funding Bodies
| Indicator | Description |
|---|---|
| Meetings with government/funding bodies on sustainability | Number of formal sustainability meetings with funders |
| Management reports to government/funding bodies | Number of sustainability reports submitted to funders |
| Sustainability initiatives supported by funders | Number of initiatives co-supported with government/funding bodies |
| Sustainability policy proposals to funders | Number of policy initiatives proposed to government or funding bodies |
Peer Universities
10 indicators
Practice — Peer Universities
| Indicator | Description |
|---|---|
| Fair competition practices | Fair conduct in student admission, staff recruitment, research, and education |
| Joint USR/sustainability initiatives | Collaborative social, environmental, research, and education programmes |
| Communication and engagement with peer universities | Formal and informal channels and frequency of engagement |
Impact — Peer Universities
| Indicator | Description |
|---|---|
| Experience sharing on sustainability | Whether experience-sharing on USR/sustainability takes place with peers |
| Attendance at joint sustainability conferences | Number of joint conferences or seminars attended with peer institutions |
| Joint sustainability classes | Existence of co-taught sustainability courses with peer universities |
| Sustainability-focused exchange programmes | Exchange programmes with an explicit sustainability focus |
| Joint education programmes on sustainability | Enrolment in shared sustainability education programmes |
| Joint sustainability initiatives | Number of collaborative sustainability projects with peers |
| Joint social projects with peers | Number of joint social responsibility projects |
Community
18 indicators
Practice — Communities
| Indicator | Description |
|---|---|
| University philanthropy to communities | Frequency and nature of philanthropic activities |
| Support for local employment | Preference for local hires, people with disabilities, immigrants, veterans, ethnic minorities |
| Voluntary USR/sustainability service | Volunteering, environmental protection, and care for disadvantaged groups |
| Sponsorship of USR/sustainability activities | Sponsorship of social responsibility and environmental protection activities |
| Communication and engagement with communities | Formal and informal mechanisms and their frequency |
| Joint initiatives with communities | Social, environmental, research, and education collaborative projects |
Impact — Community
| Indicator | Description |
|---|---|
| Number of donations to communities | Monetary and in-kind donations made in the reporting year |
| Community projects supported | Total number of community projects the university supported |
| Long-term community projects (3+ years) | Number of ongoing projects sustained for three or more years |
| Community projects with NGOs | Jointly organised projects with non-governmental organisations |
| Community projects with businesses | Jointly organised projects with the business community |
| Staff participation in community services | Percentage of staff engaged in community sustainability services |
| Staff hours in community sustainability services | Average hours per employee per year in community service |
| Media coverage of community activities | Number of media reports about the university's community sustainability work |
| Community complaints on sustainability | Presence of complaints from the community regarding sustainability |
| Business information sessions on sustainability | Sessions sharing and promoting sustainability with the business community |
| Knowledge transfer projects to business community | Projects involving sustainability knowledge transfer to businesses |
| Business endowments for sustainability | Number of endowments from the business community for sustainability programmes |
Environment
16 indicators
Practice — Environment
| Indicator | Description |
|---|---|
| Environmental management policies | Existence of formal environmental management policies |
| Environmental management system | Establishment of a formal environmental management system |
| Environmental monitoring systems | Systems for ongoing environmental performance monitoring |
| Environmental performance indicators tracked | Energy, water, waste, emissions, biodiversity, and other metrics actively measured |
| Communication on environmental practices | Mechanisms for sharing environmental performance with stakeholders |
Impact — Environment
| Indicator | Description |
|---|---|
| Energy consumption reduction | Percentage change in energy use compared to previous year |
| Water consumption reduction | Percentage change in water use compared to previous year |
| Indoor air quality | Whether indoor air quality has improved |
| Recycling rate | Current recycling rate (0% / 0–20% / 20–40% / >40%) |
| Reduction of solid waste to landfills | Percentage decrease in landfill-bound solid waste |
| Reduction of hazardous waste disposal | Percentage decrease in hazardous waste disposal |
| Environmental programmes organised/sponsored | Number of environmental programmes run or supported |
| ENGO collaborations | Number of collaborations with environmental NGOs |
| GHG emissions reduction | Percentage reduction in greenhouse gas emissions year-on-year |
| Increase in greenery areas | Whether campus green space as a share of total area has grown |
| Complaints related to environment and pollution | Presence of environmental or pollution-related complaints |
Suppliers
12 indicators
Practice — Suppliers
| Indicator | Description |
|---|---|
| USR/sustainability criteria in procurement | Application of sustainability standards in supplier selection and contracts |
| Supplier USR/sustainability policy | Formal written policy governing supplier sustainability conduct |
| Monitoring supplier sustainability performance | Audits, inspections, and submission of CSR/sustainability information by suppliers |
| Communication mechanisms with suppliers | Frequency of calls, site visits, meetings, online communication, and feedback |
| Materiality of supplier engagement | Nature and significance of sustainability engagement with suppliers |
Impact — Suppliers
| Indicator | Description |
|---|---|
| Local supplier share | Percentage of suppliers that are local (<50% / 50–80% / >80%) |
| Long-term supplier share (3+ years) | Percentage of suppliers with relationships of 3 or more years |
| Meetings and inspections with suppliers | Number of monitoring interactions with suppliers in the year |
| Suppliers with SER collaboration | Percentage of suppliers engaged in social/environmental responsibility work |
| Complaints about suppliers | Number of complaints about suppliers lodged by students or employees |
| Complaints from suppliers | Number of complaints received from suppliers |
| Supplier violations of regulations/contracts | Number of documented supplier violations |
The index universities are categorized into 6 tiers based on the scores attained, with each tier representing the level of achievement in their sustainability journey.
| USI Score | Tier |
| 90 – 100 | Global Icon |
| 80 – 89 | Impact Leader |
| 70 – 79 | Model Achiever |
| 60 – 69 | Proactive Advocate |
| 50 – 59 | Committed Partner |
| Below 50 | Emerging Follower |
Access the full University Sustainability Index report for detailed findings, rankings, and analysis.